Monitoring Solutions for Bridge Construction: System Examples
A bridge can look unchanged while conditions at its structure or construction site are shifting. Effective monitoring solutions for bridge and overpass construction combine visual inspections with continuous structural data and remote observation. A typical first deployment on a medium-span bridge uses four to eight triaxial accelerometers, along with tiltmeters and a temperature channel.
Visual checks remain essential, but they capture a moment rather than a continuous record. Sensors track movement and vibration over time, while remote cameras show site activity and construction progress. Each serves a distinct purpose: cameras document what is visible, and structural instruments measure how the bridge responds.
This guide covers practical monitoring examples and how teams can combine methods to support informed decisions during construction. It explains how remote systems improve worksite visibility, how continuous data complements inspections, and what bridge-monitoring cases reveal in practice. The focus is useful oversight, not treating camera footage as a substitute for engineering measurements.
Key Takeaways
- Use visual inspections alongside continuous structural data so teams can compare observed conditions with changes over time.
- Match sensors to the monitoring objective, then organise readings so engineers can review trends and investigate threshold alerts.
- Use monitoring data during load tests and construction stages to help assess bridge response and support project decisions.
- Remote site cameras can improve visibility of construction activity and document progress, while structural sensors measure bridge behaviour.
- Solar-powered camera tower hire can support remote visual oversight when a project needs accessible site footage and time-lapse records.
Complementing visual inspections with continuous monitoring
A visual inspection records a structure’s visible condition at a particular time. Continuous monitoring adds evidence of how it responds between inspections. These methods answer different questions: inspectors identify and describe defects, while measurements show whether movement or vibration changes over time. On a bridge, engineers can compare the location of cracks and surface damage with sensor readings from the same structural area. Environmental data, such as temperature, can also help distinguish changing conditions from a developing structural response.
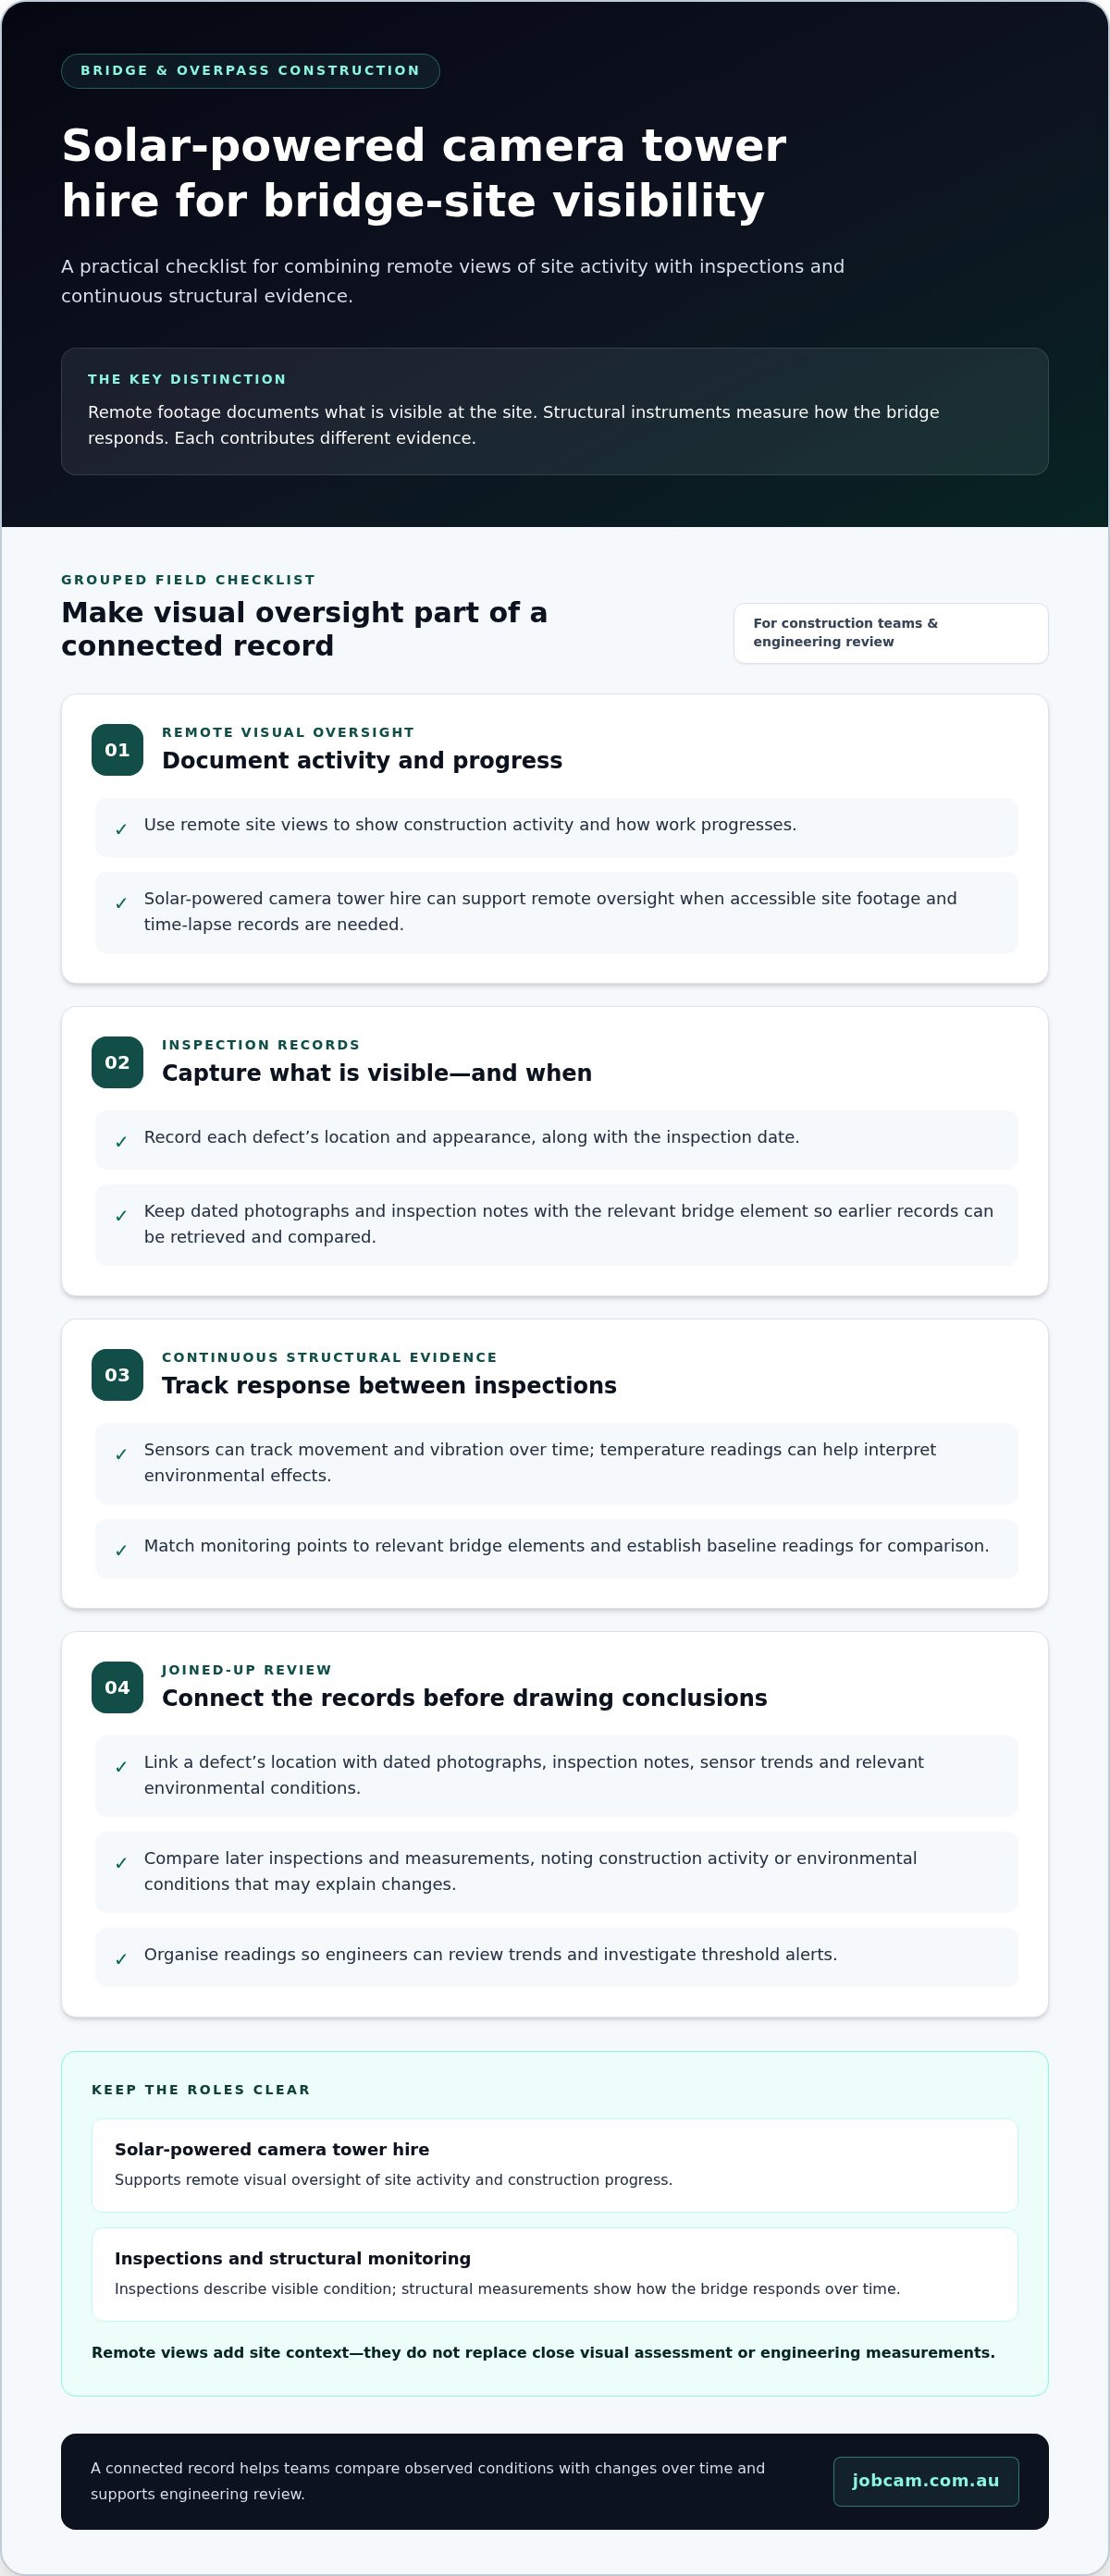
Use both methods as part of a connected workflow. First, record each defect’s location and appearance, along with the inspection date. Next, match monitoring points to the relevant bridge elements and establish baseline readings. Compare later inspections and measurements, noting construction activity or environmental conditions that may explain any changes. This creates a traceable record for engineering review and collaboration across inspection, construction and asset-management teams. Digital records also make it easier to retrieve earlier images, notes and readings without relying on separate paper files.
Regional bridge project: monitoring while repairs were planned
Situation: A damaged bridge required closer assessment during construction and upgrade phases. Action: The bridge engineer specified tilt meters on several piers to refine the finite-element model. Result: Monitoring helped manage community risk while the bridge remained open to traffic as repairs were planned and carried out. This example shows how continuous measurements can add context to visual defect assessments and inform decisions about changes in structural behaviour when implementing monitoring solutions for bridge and overpass construction.
Metropolitan overpass structure: detecting events between inspections
Situation: A quarterly walk-over inspection provided periodic observations, but could not capture every vehicle event. Action: At the overpass site, six months of accelerometer data were analysed to establish a modal baseline. The monitoring system also detected heavy vehicle loads exceeding operational thresholds. Result: The data revealed events that the quarterly inspection would not have seen, illustrating how continuous records complement scheduled site visits.
Digital inspection and asset-management software, such as Jobcam platforms, can bring these records together. A useful entry links a defect’s location with dated photographs, inspection notes, sensor trends and relevant environmental conditions. Engineers can then assess whether a visible change coincides with a measured response, rather than reviewing each record in isolation. Clear timestamps and consistent names for bridge elements make comparisons more useful as construction progresses and asset records are updated.
Periodic inspections remain essential for documenting visible condition and supporting bridge integrity. Continuous monitoring extends the evidence between visits; it does not replace close visual assessment. Together, inspection records and measurement trends give engineering teams a fuller basis for identifying changes, directing investigations and maintaining a useful asset history.
Bridge monitoring system components and data pipelines
A bridge monitoring system connects sensors, communications, data processing and engineering review. Each component has a clear role: devices collect measurements, a network transmits them, and software organises readings for interpretation. On Australian infrastructure projects, the system should suit the structure, construction stages and decisions it needs to support. A sensor without a clear purpose adds data, but not necessarily useful evidence.
In Australia, bridge monitoring system costs depend on the project and are provided after a quote request. Key cost factors include the number and type of devices, installation requirements, communications, monitoring duration and data analysis needs.
Start planning by defining the question: what structural response needs to be measured, where, and during which work stages? Engineers can then select devices, position them in relation to the relevant bridge elements, establish baseline readings and set review or alert procedures. The plan should also assign responsibility for checking data and investigating changes.
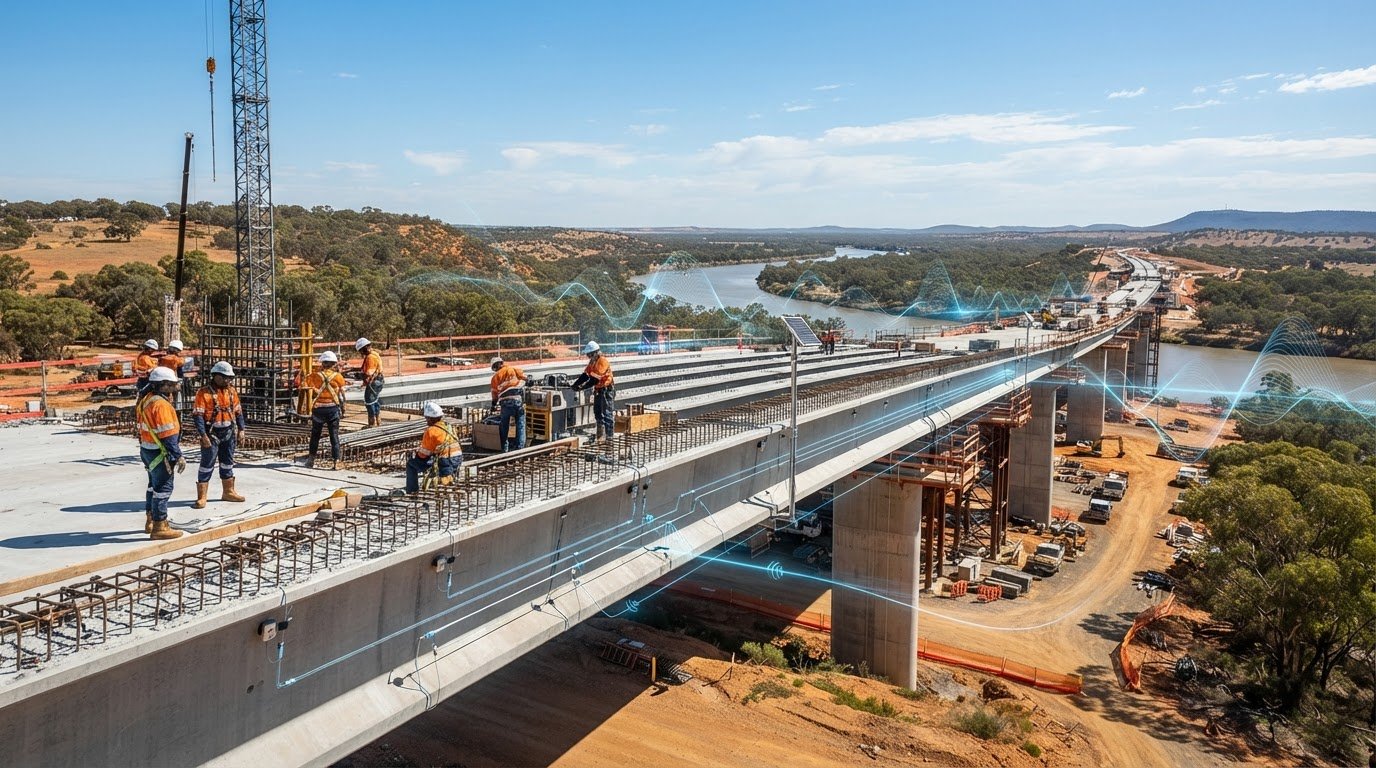
A typical first deployment on a medium-span bridge uses four to eight triaxial accelerometers, along with tiltmeters and a temperature channel. Accelerometers record vibration in three directions; tiltmeters measure changes in angle, and temperature readings help interpret environmental effects. For tiltmeters monitoring bridge movement, sub-milliradian resolution is a worthwhile threshold. Placement depends on the structure and monitoring objective, with critical elements selected to suit the required measurements.
The data pipeline starts at each device. Readings are timestamped and sent through the chosen network to a system for storage and processing. Software can present trends, flag readings against predefined thresholds and support engineering review. A useful record links each measurement to its device location, units, time and relevant construction activity. Teams should define how they will record and handle missing data, communications interruptions and alerts. Clear data ownership and access rules also support collaboration across engineering and construction teams.
Stura Bridge example: Researchers needed a detailed digital representation of the bridge. They merged laser-scanner output with photogrammetry output to create a full point cloud. Processing used a computer with 32 GB of RAM and an Intel Core i7-10700 K processor. The result combined two capture methods into one spatial dataset, showing how separate data streams can be aligned for structural assessment.
Visual site records answer a different question from structural measurements: they show what work was occurring around a reading. For remote visibility of construction activity, remote monitoring camera options can provide an additional site record alongside engineering data.
At Chetwynd Bridge, monitoring detected illegal overweight vehicles that a quarterly walk-over inspection would not have seen. The example shows how continuous data can reveal events between inspections.
Data to support safer project delivery
Monitoring data supports decisions when it connects a measured change with a construction activity. Sensors collect readings at critical locations, while engineers compare the results with inspection records, load-test stages and site conditions. This gives the team a joined-up view of the evidence instead of leaving readings isolated. The practical value is a clear record of what changed, when it changed and what needs review before work proceeds. Well-planned monitoring solutions for bridge and overpass construction connect evidence to clear project decisions.
Inadequate monitoring can leave structural changes or unusual responses undetected between inspections. Teams may then make decisions with incomplete evidence, increasing the risk of delayed investigations, disrupted work or traffic restrictions.
New South Wales bridge after flooding: Situation: Floods in 2021 led to a program of underwater bridge inspections across New South Wales. One bridge was found to have defects and was immediately closed to traffic, isolating a community. Action: Engineers used successful load tests to assess the bridge’s response. Result: The bridge reopened to traffic after those tests. The case shows how inspection findings can trigger further assessment, while measured performance can support a decision about reopening.
Load testing also demonstrates how monitoring supports planned construction or repair stages. In one bridge case, the structure underwent progressive load tests. Monitoring data verified test results and helped check for adverse effects at critical locations. Ongoing monitoring then supported reopening and provided risk indicators. The sequence matters: collect readings at each test stage, compare them with the expected response, investigate unusual results and document the decision before proceeding.
For project teams, a useful data review links each measurement to its location, test stage and time. Engineers can then identify whether a change occurred during loading, construction activity or another recorded condition. Keep readings, inspection findings and decisions in one traceable record. List critical locations and the thresholds that require investigation in the monitoring plan, so every team member knows what action to take after an alert.
Before a load test, agree on who reviews the readings and who can pause work for investigation. During testing, compare sensor results with the planned sequence and inspect any unexpected response. Afterward, record the outcome, relevant observations and next review step. This gives engineers and construction leads a consistent basis for collaboration rather than relying on informal updates.
Monitoring does not make a project risk-free or replace engineering judgement. It gives the team evidence to assess changing conditions and document decisions. On a bridge carrying traffic, that record can connect structural performance with practical choices about testing, work sequencing and access. Clear responsibilities and timely review turn collected data into useful project information, helping teams make informed decisions as work progresses.
Remote monitoring of bridge construction and safety
Australian bridge monitoring should follow the project specification, the asset owner’s requirements and relevant approvals. Before work begins, the plan should identify the risks being measured, monitoring locations, alert process and responsible reviewers.
Near roads, railways or utilities, map each interface and define how movement readings will be reviewed alongside construction activity. Record in the monitoring plan who receives alerts and what investigation should follow a change.
Australian bridge monitoring may involve structural engineers and specialist instrumentation teams who select sensors, interpret measurements and report findings. Remote cameras can document visible site activity, but they do not measure structural movement or replace engineering instruments.
Remote monitoring helps teams observe areas that are difficult to visit frequently. It can support oversight of structural, geotechnical and environmental conditions by linking observations with construction stages. Camera footage can document access, work sequencing and visible site changes. A total station or other survey instrument serves a different purpose: it measures the position of selected points. Keep these sources distinct in reports, then compare them where their timelines overlap.
Plan remote monitoring around decisions, not just equipment locations. First, identify the bridge element, work activity or nearby interface that needs observation. Next, choose a suitable measurement method, such as survey points for movement or sensors for structural response. Then document baseline conditions, review intervals, alert thresholds and escalation responsibilities. Record weather, site disruptions and construction milestones clearly. This helps engineers interpret changes in context rather than treating every movement reading as evidence of damage.
Brisbane’s Story Bridge: Situation: Work on a pedestrian- and cyclist-friendly underpass on the bridge’s south side was completed in 2023. Action: Monitoring ran for a year during construction, while teams observed the bridge columns. Manual measurements after site disruptions showed an average residual of approximately 1 mm. Result: No shifts in the columns were detected during construction. The example shows how remote observation and manual measurement can document different parts of a construction period.
For a heritage structure, monitoring plans should also record nearby work and visible changes without treating camera footage as a structural assessment. At a bridge beside live traffic, define safe access and observation positions before site activity starts. Near railways or utilities, coordinate monitoring locations with the relevant interface and project staging. These steps help teams link observations to work underway without confusing visual records with measured movement.
Remote monitoring is most useful when records are reviewed consistently. Assign a reviewer, record the time and location of each observation, and connect it to the relevant construction stage. If a survey point changes, compare its measurements with earlier readings and recorded site conditions. This process gives project teams a traceable basis for investigation and communication.
Bridge monitoring should follow the project specification, the asset owner’s requirements and relevant approvals.
What monitoring solutions are used during bridge and overpass construction?
The right system depends on what the project needs to observe. Structural sensors measure vibration, tilt or movement; survey instruments track selected points; and visual records document site activity. These methods provide different evidence, so engineers should match each device to a clearly defined monitoring question. A useful plan identifies the bridge element, construction stage, data reviewer and required action when readings change.
Accelerometers record vibration, while tiltmeters track angular movement in critical elements. Temperature channels help interpret environmental effects: a bridge’s natural frequency can shift by several percent over a day as temperature changes. The first few bending modes of a medium-span road bridge usually occur below 10 Hz. These details help engineers choose measurement ranges and interpret trends without treating every fluctuation as structural damage.
For tilt monitoring, sub-milliradian resolution is a worthwhile threshold. Compare real-time readings on critical bridge elements with predefined thresholds. If a threshold is exceeded, the alert should prompt immediate investigation. Before work starts, assign responsibility for receiving alerts, reviewing data and recording decisions. This response pathway makes measurements useful to the construction team.
- Vibration: accelerometers record the bridge’s dynamic response during relevant work stages.
- Tilt: tiltmeters track angular changes in selected structural elements.
- Survey: a total station measures position changes at established points.
- Visual records: site imagery documents visible activity and construction progress.
Wireless monitoring can simplify installation where cable routing is difficult. Published comparisons cited in the research place wireless bridge-monitoring installation at well under half the cost of the wired equivalent. This comparison covers installation, not the full cost of a monitoring system. The choice still depends on site layout, device placement, communications and monitoring duration.
Illustrative pier example: A project team needs to observe a pier during nearby construction. Engineers select a suitable movement measurement, establish a baseline and define an alert threshold before work starts. If readings exceed the threshold, the assigned reviewer investigates and records the finding. This step-by-step process links the device to a decision instead of collecting data without a response plan.
Combine methods when the project needs both structural measurements and a record of visible work activity. Keep sensor readings, survey results and site records clearly labelled by location and time. For a practical way to plan visual site coverage, map construction-site visibility needs alongside engineering monitoring locations.
Combine methods when a project needs evidence of both movement and site activity: use structural readings for measured changes, survey points for position, and imagery to document visible progress. Tie each observation to a defined question and reviewer, so the team can distinguish what a reading shows from what it does not establish. Monitor real-time tilt readings on critical bridge elements against predefined thresholds; if a threshold is exceeded, trigger an alert and immediate investigation. Record who reviewed the alert and what follow-up took place. This makes monitoring a practical part of construction control: measurements are interpreted in context, concerns are investigated promptly, and the team has a clear record of decisions.
Jobcam: Solar Security Cameras
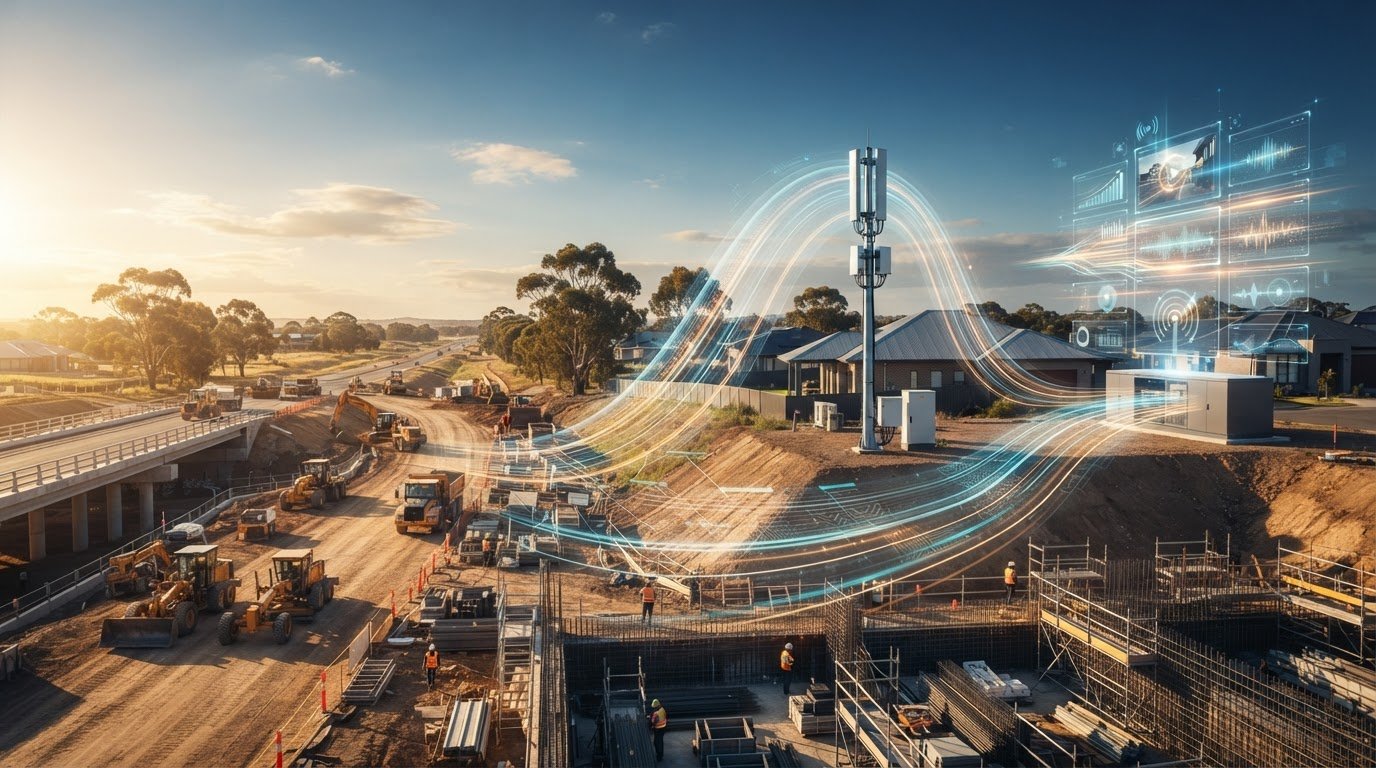
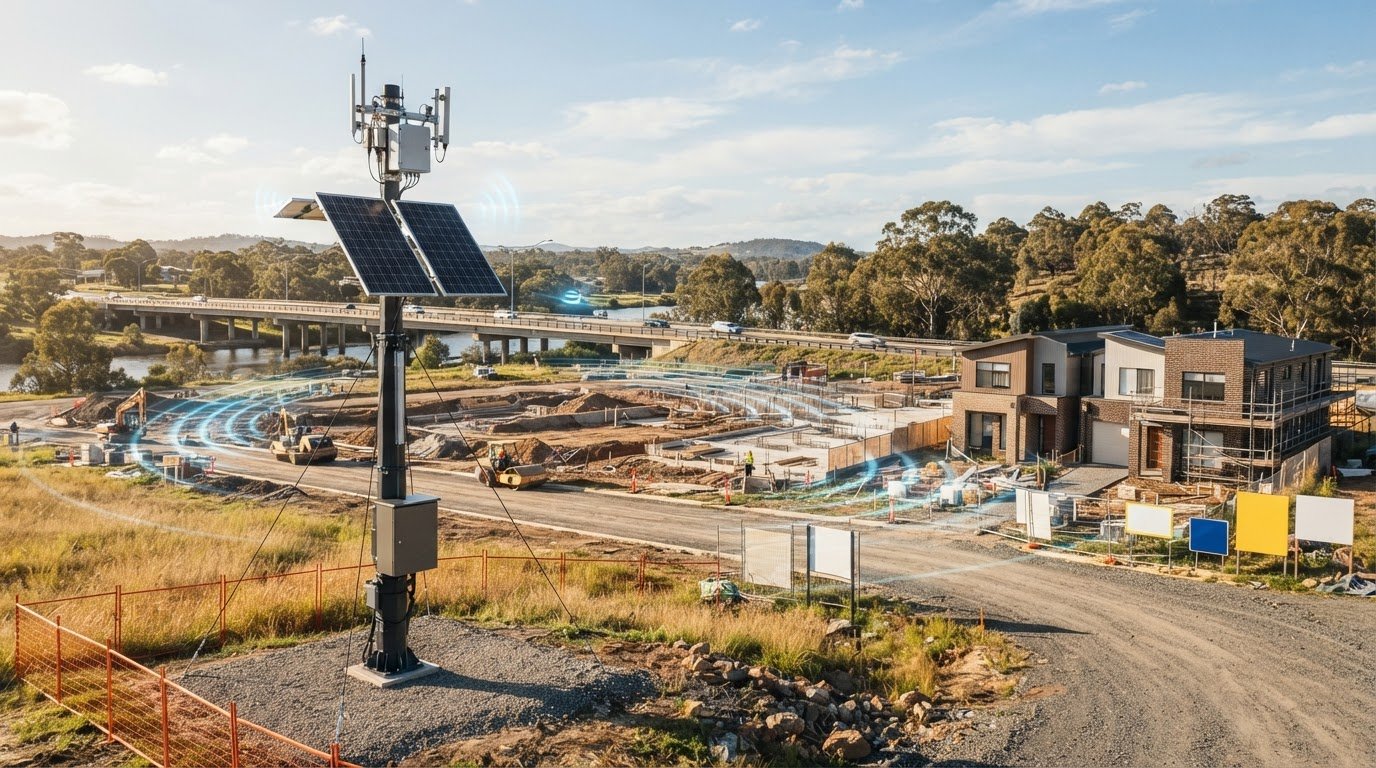
Jobcam helps construction teams add remote visual oversight through solar-powered camera tower hire. For bridge and overpass projects, Solar Surveillance Towers and Project Management Cameras provide site visibility, while Time-lapse Video Cameras document progress over time. Use them to observe construction activity and keep visual records accessible to project stakeholders. They complement structural sensors and engineering inspections, but do not measure bridge movement or replace structural monitoring.
Footage is available through a secure cloud platform, with real-time monitoring and playback through a mobile app or web interface. Telstra 4GX connectivity and AWS servers support access to stored footage, including if hardware is damaged or stolen. Choose this visual layer when project teams need remote access to site footage or a clear progress record. Contact Jobcam to discuss camera tower hire for your construction project.
Set the next project stage up for clear oversight
Before construction advances, turn the monitoring approach into a practical project brief. Define which decisions the evidence needs to support, who will review it and how updates will reach relevant stakeholders. Align these responsibilities with construction milestones so teams know when observations are needed and how findings will inform the next stage. This keeps monitoring solutions for bridge and overpass construction connected to project delivery, rather than treating data collection as a separate task.
Visual records can also help project teams communicate progress to stakeholders who are not on site. Jobcam offers Solar Security Cameras, Solar Surveillance Towers and Time-lapse Video Cameras for hired site visibility and project documentation. These tools complement engineering monitoring by recording visible work activity, not by replacing structural assessment.
Build a monitoring plan that reflects the bridge, the work sequence and the people who need access to project information. For a practical discussion about visual oversight for your construction project, contact Jobcam to discuss monitoring. Clear planning gives your team a stronger starting point for the work ahead.
Frequently Asked Questions
Which sensors are used to monitor bridges during construction?
Common options include accelerometers, tiltmeters and temperature sensors, selected to suit the bridge and monitoring objective. For example, engineers may use accelerometers to examine vibration during a construction stage, while temperature readings help interpret changes in structural response. Sensor selection should account for the element being observed, the expected type of change and how results will inform decisions. Site cameras provide visual context but are not structural measurement sensors.
How do automated monitoring systems compare with manual surveys for bridge construction?
Automated systems can collect readings between site visits, helping teams identify when a change occurred. Manual surveys provide deliberate measurements at selected points and can help validate an unexpected reading or establish site context. For example, if an automated alert appears during a concrete pour, a survey can help assess the relevant location. The methods serve different purposes, and teams can use both when continuous records and independent checks are valuable.